
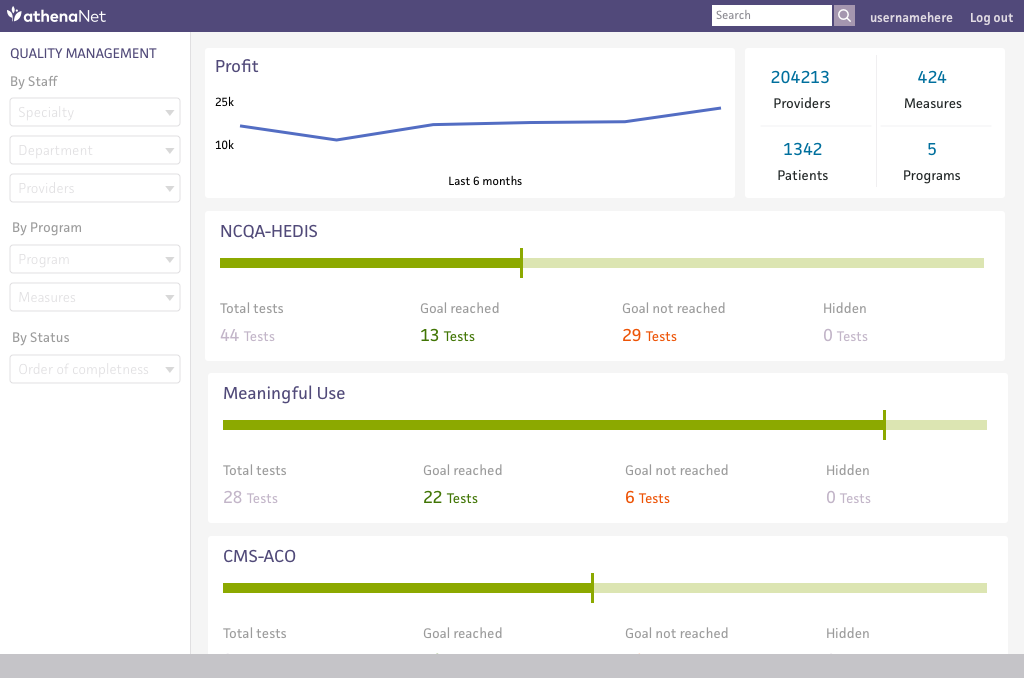
Quality Management
Quality Management is the practice of tracking clinical outcomes to improve the effectiveness of providers and healthcare organizations.
Outcome: The larger product zone vision, end-to-end user workflows, and validation of development strategy wouldn’t have been possible without the Quality Management expertise gained over a year.
Role: UX research, design, and strategy
Team: Product and engineering leads for three scrum teams
Timeframe: May 2017 to May 2018
The problem
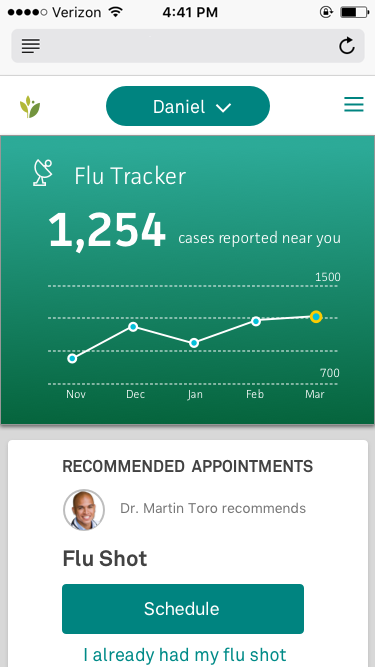
What does Quality Management look like? A doctor is financially incentivized by the government or an insurance company to get patients in for preventative visits. A patient comes in for a visit, gets preventive screenings done, and the doctor gets paid.
Calculating which patients need to come in for which procedures with which physicians at which location is where things get complicated.

These are a few pages of measure documentation from CMS (Centers for Medicare and Medicaid Services) and HEDIS (Healthcare Effectiveness Data and Information Set).
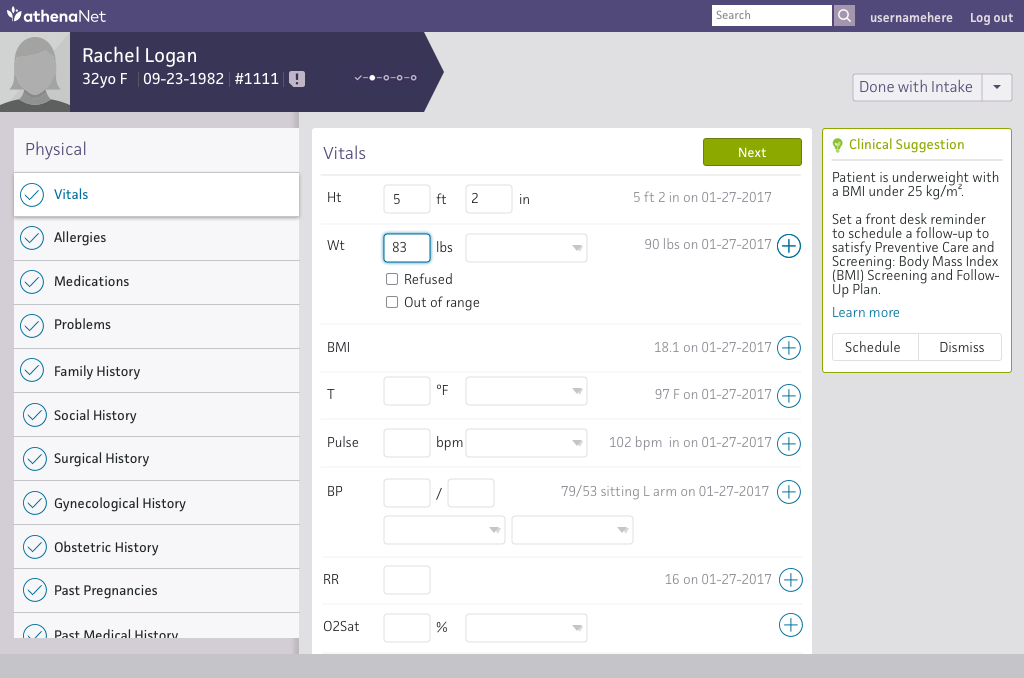
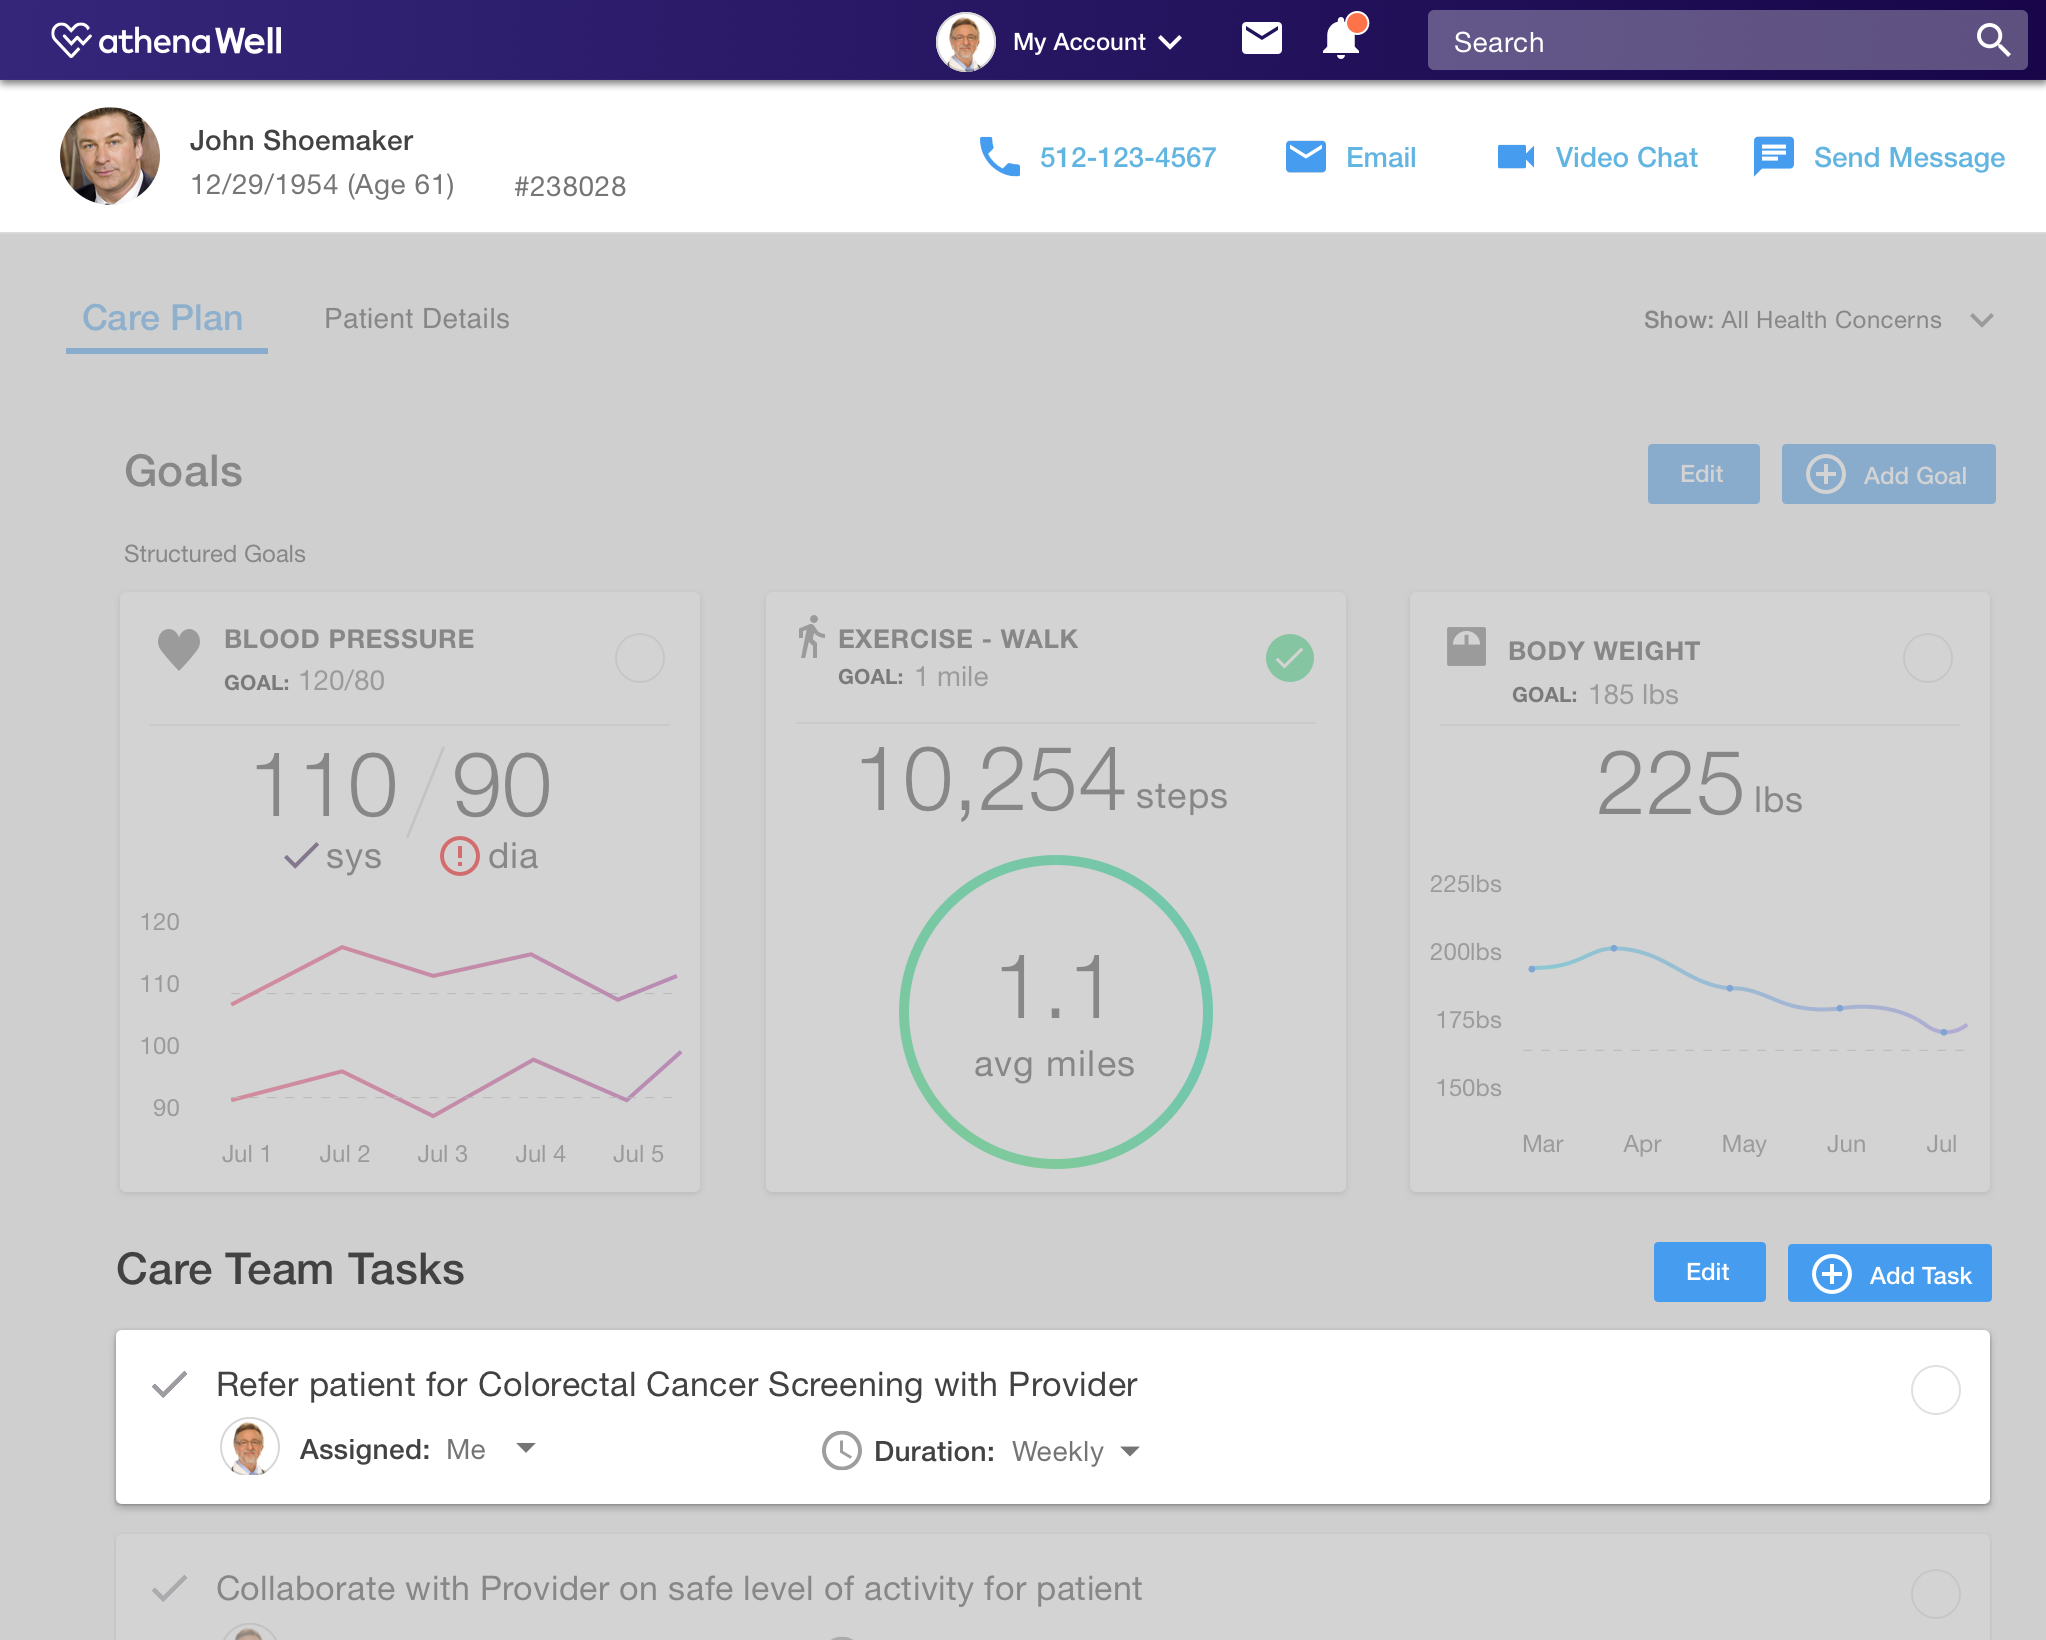
Athenahealth had two products that calculating if a quality measure had been satisfied or not: Population Health and Clinicals (the EHR).
Both systems ingested data from different sources. For the Population Health product, data came from claims and manually input results. In Clinicals (the EHR side) data came from patient charts and reconciling labs. This meant clients who had both products might see discrepancies between the two products.
Both systems had different users types with distinct skill sets. The Population Health engine is entirely back end and requires SQL developers. The Clinicals Engine has a very clunky UI that requires a highly trained user.
Neither product was scalable. The two engines are built very differently as well, but neither one is scalable or efficient enough to handle new clients or updates year to year.

Redesigning the new engine should alleviate three major problems: scalability, efficiency, and accuracy.
Research
Uncovering complexities
The complexities of how quality measures are written required significant ramp up work. I led exercises with my team to translate these requirements into “components” that could be turned into code snippets.

Understanding internal user pain points
To understand user needs for the products, I ran two remote Mural sessions. I facilitated listing pain points, affinity mapping, and ranking issues on a severity map.

Population Health team

Clinicals team
Key findings:
Both teams struggled to set measures by time period. Population Health wanted to report based on more complicated measure specifications. Clinicals wanted calendar year measures.
Both teams wanted measure building capabilities. For Population Health it was flexibility and transparency. For Clinicals it was building more measures clients requested.
Population Health users noticed inaccuracy of the data more. Most Pop Health clients used Clinicals, but many Clinicals clients didn’t use Pop Health.
Insurance enrollment was only a big issue for Population Health. Because Clinicals didn’t use insurance data for calculations, enrollment wasn’t a concern.
The first round of designs
After sketching from the exercises above, I began designing an engine that could manage and build programs and measures from scratch. I ran two rounds of moderated sessions with both groups of users that build measures. These sessions tested the usability of the designs and also built an understanding of how users think about measures conceptually.

From the excel exercises, I visualized different component types and how a user might designate the correct values for each one.
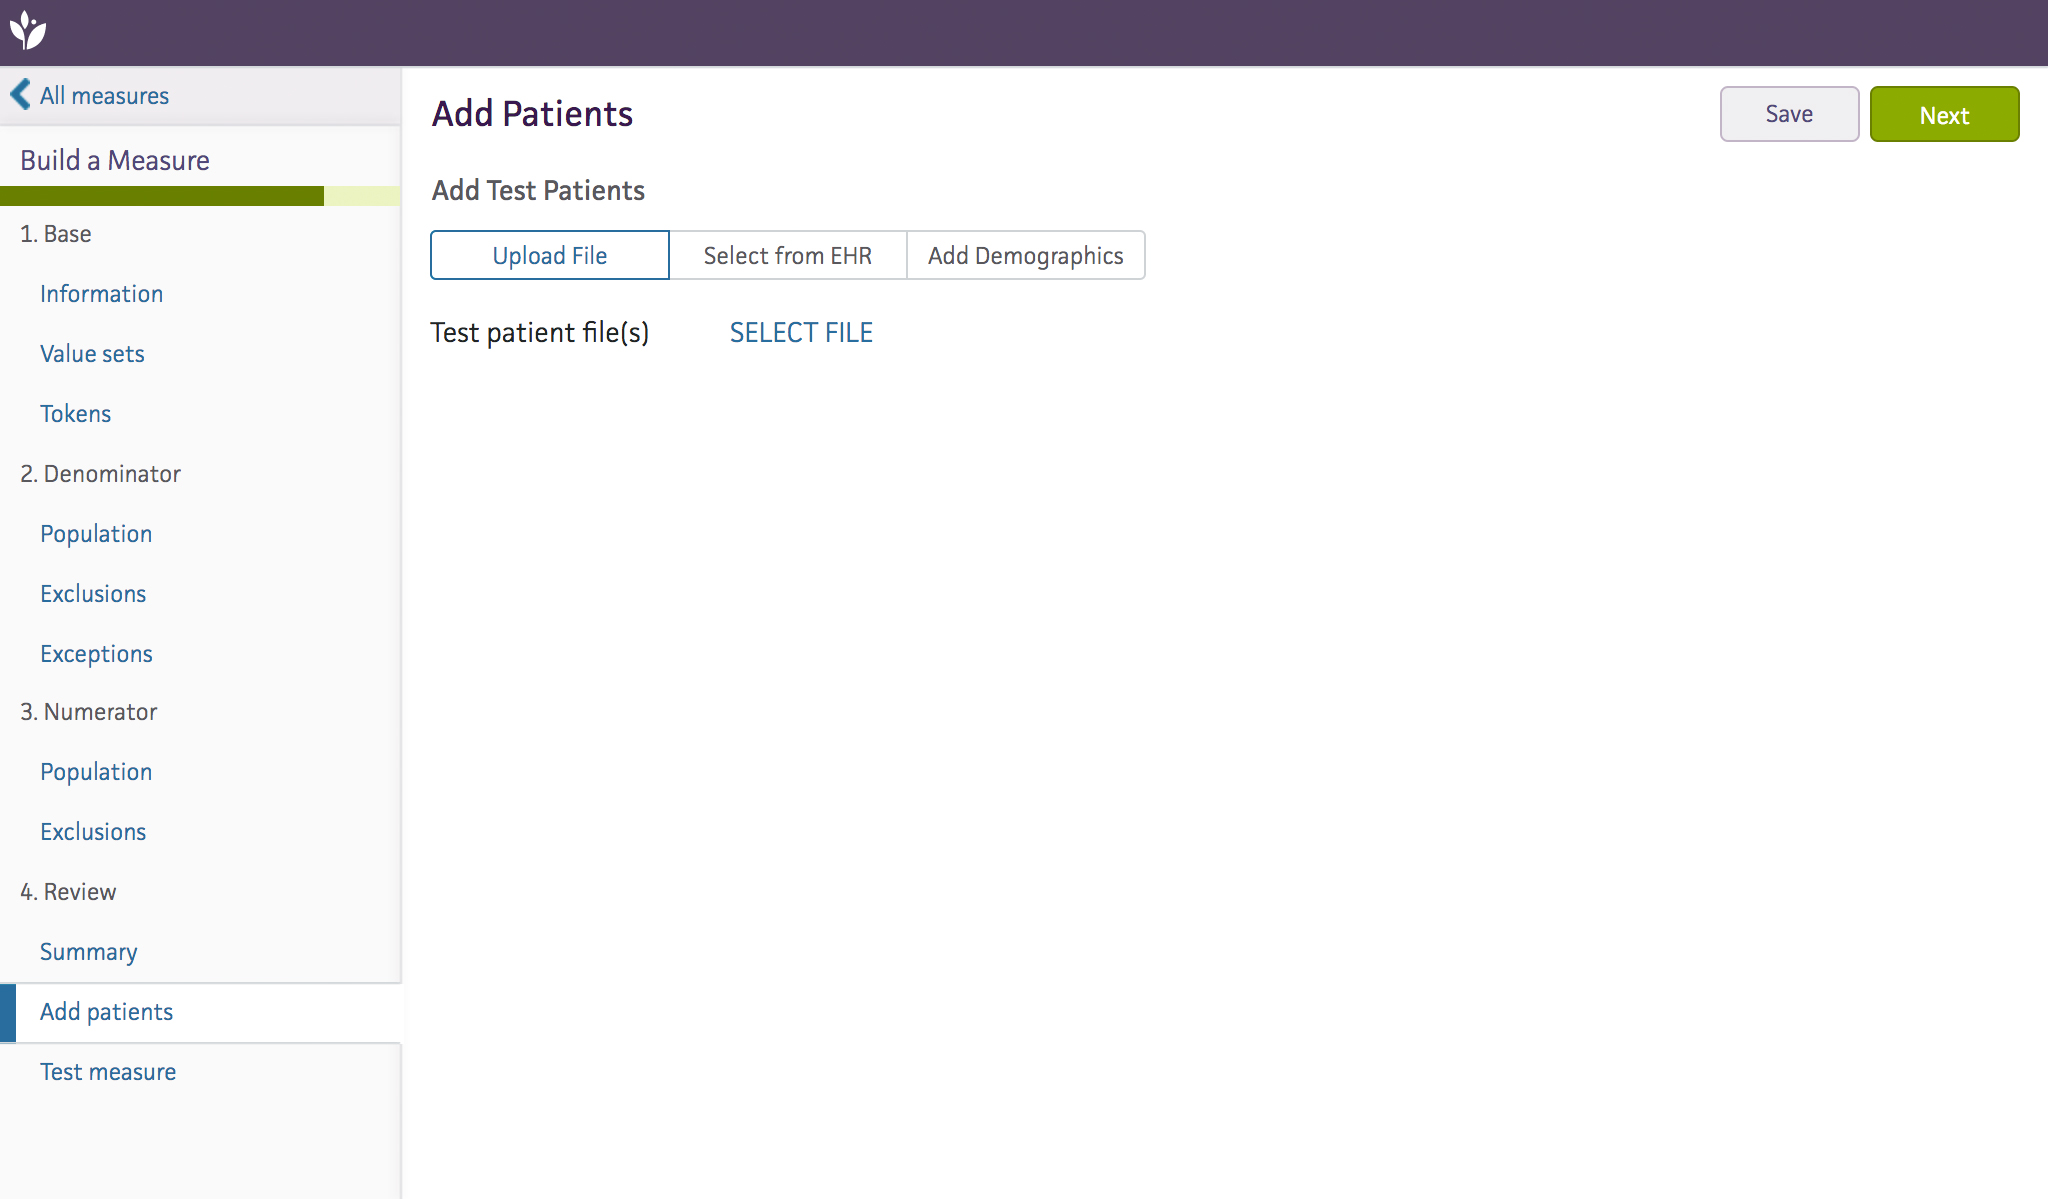
One of the Axure prototypes used to test the usability of a complex measure builder with current internal users.

Analysis of one of the usability studies.
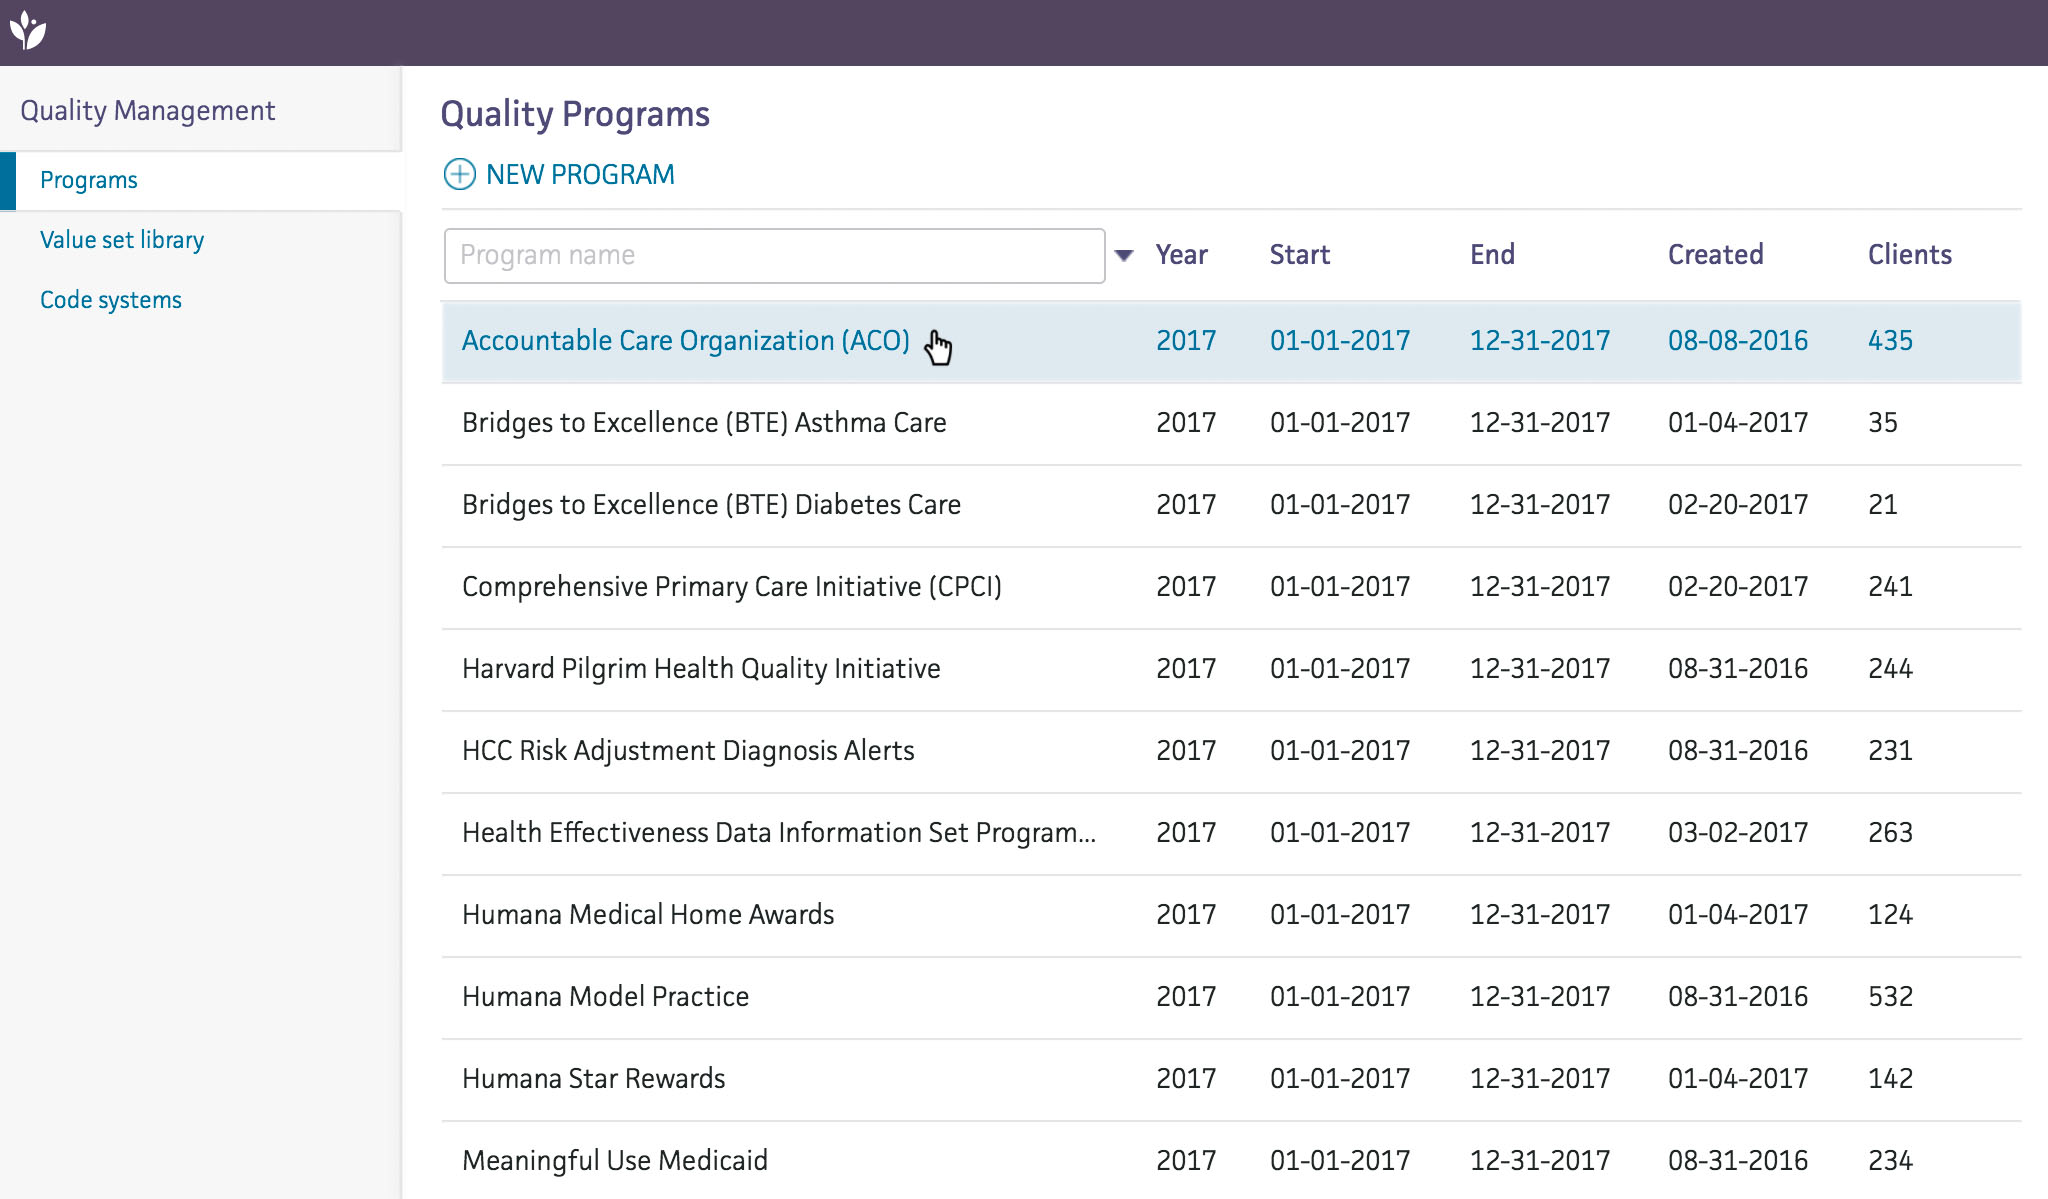
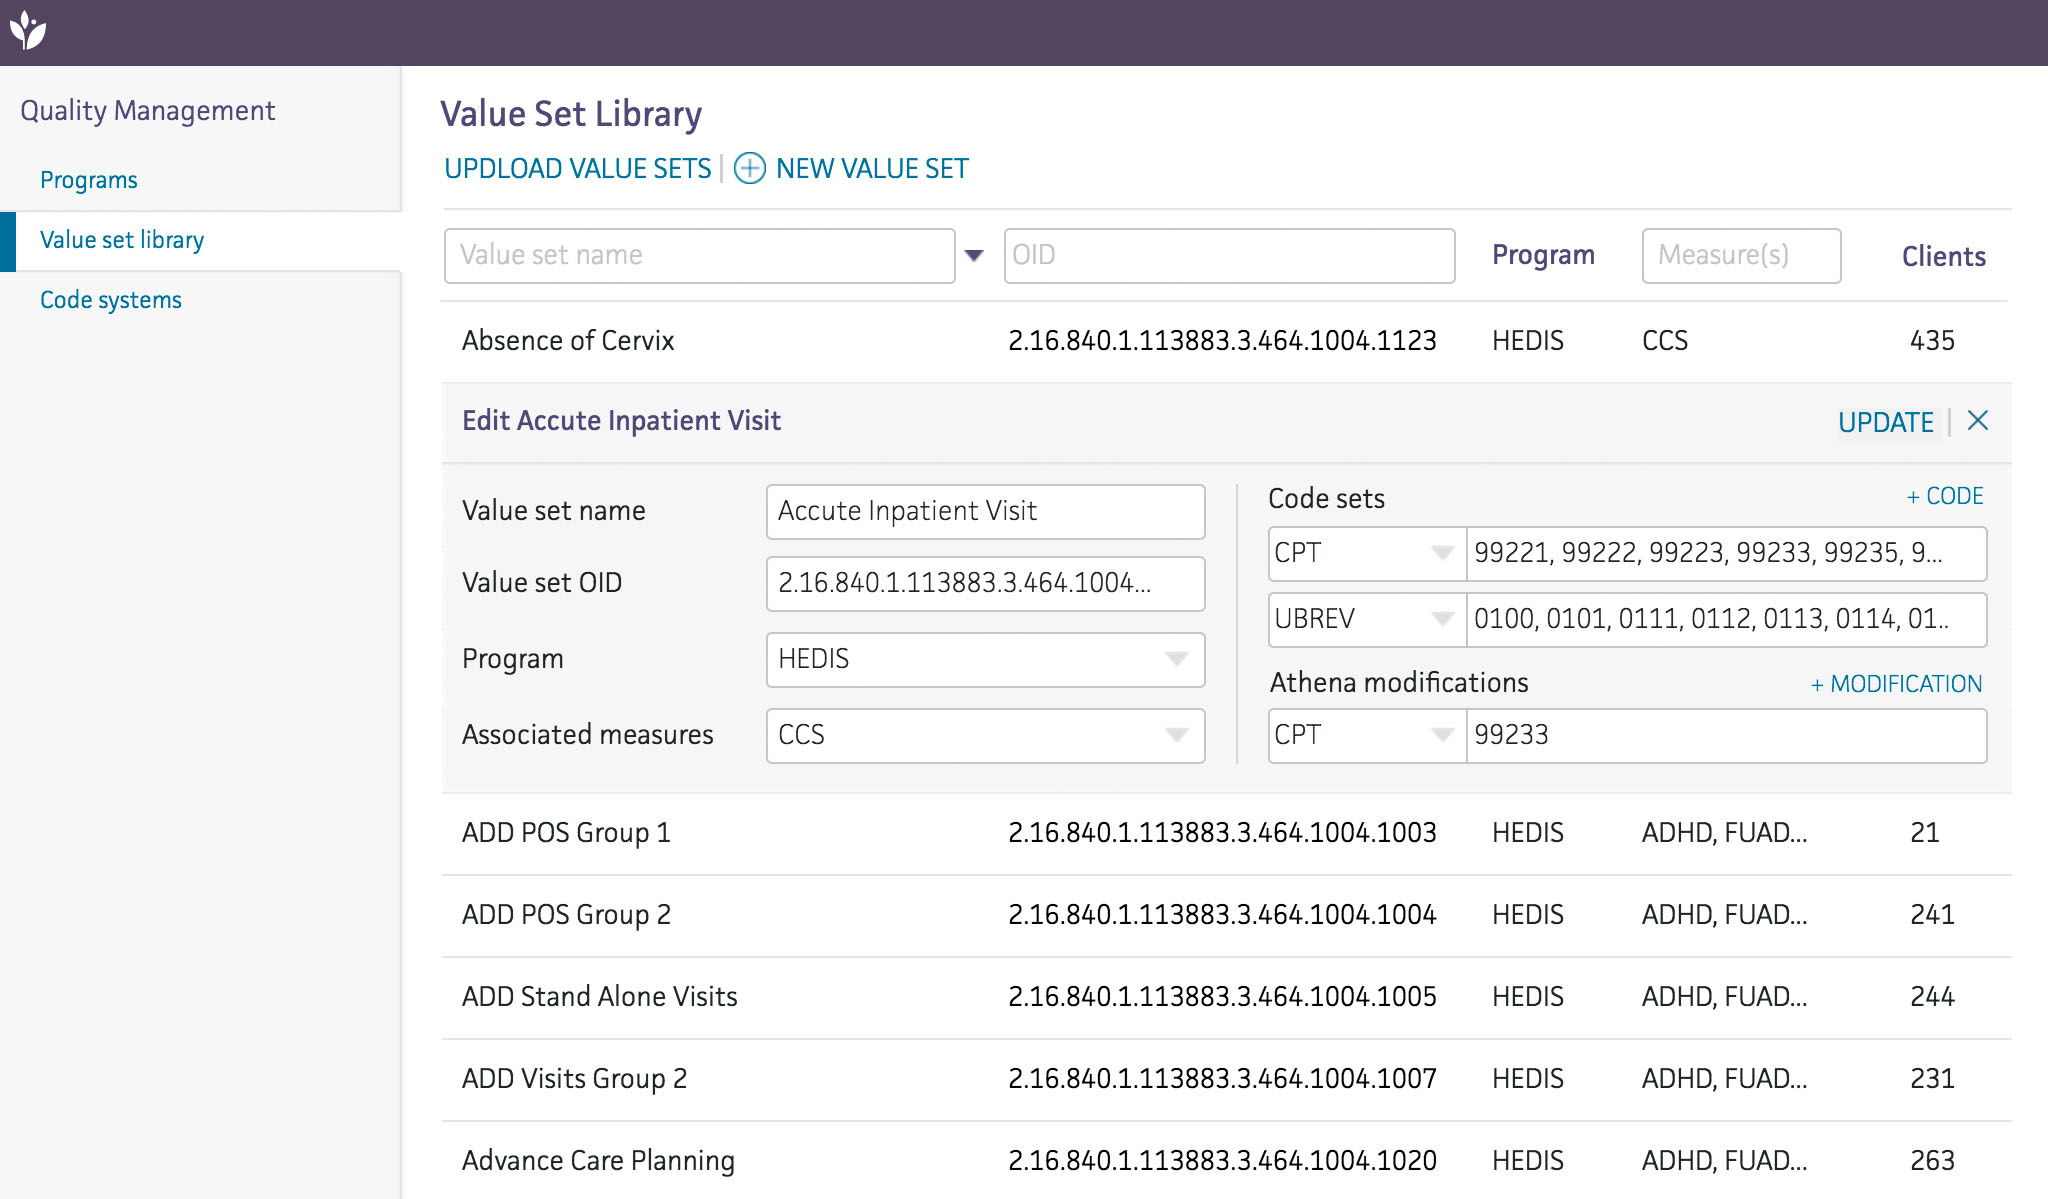
Ultimately, our team pivoted to build out one measure using Clinical Quality Language as a way to prove out technical capabilities first. These initial designs still visually informed the structure of measures. We also uncovered a few administrative interfaces required to manage Quality programs.
Vision & more research
Outside of measure building, there was little work done to understand the end-to-end Quality journey. I began to identify users and built out personas for the primary users.

To unify the team, I ran a vision exercise with product and tech leads to gather potential inputs and outputs of quality data. Before Quality Management, people had worked in Clinicals, Care Management, Outreach Management, and Scheduling so we were able to gather a wide variety of ideas.
From the vision exercise, I designed a few mockups to get people thinking about the future of quality at different product meetings.
End-to-end workflows
Multiple site visits, diving into quality management, and analyzing a specific Account Manager’s work helped map an end to end user journey for our top five users.
Potential workflows and interfaces across the zone
To paint a broader picture and explain to those outside our zone what we were tackling, I created a visual workflow with potential interfaces on how our three scrum teams worked together.

Experimentation for validation
To quickly test out larger concepts to define a direction for the team, I ran a series of experiments validating different areas of the Quality Management Engine. A lot of this preliminary research went on to define not only the strategy for the Quality Management Engine but also what quality management should look like across athena products.

One experiment was to identify what skill set an operations team member would need if we didn't build out a full UI for creating or customizing measures. Working with my product owner, we identified the hypothesis that users could use Clinical Query Language to make simple customizations. From there I wrote a moderator guide with tasks using CQL instead of a UI.
Key finding: The team would have to invest in an operations team of technical business analysts to proceed with a CQL only engine.
Outcome
The expertise and knowledge gathered over the year set me up to succeed on Quality Reporting. Additionally, the product zone vision, end-to-end user workflows, and validation of development strategy were instrumental in product direction.